πŸ‘‹
Welcome to my Portfolio! Thanks for visiting β€” feel free to explore my work!
βœ•
πŸ“Š Available for Opportunities

Mohan S

SQL Β· Python Β· Machine Learning Β· Tableau Β· Business Intelligence

Transforming raw business data into actionable insights using analytics, machine learning, and visualization tools that drive measurable outcomes.

Customer Churn Prediction Model
87.4%
Model Accuracy Β· Scikit-learn Β· Python
Identifies high-risk customers before they churn, enabling proactive retention strategies through predictive ML segmentation.
Fraud Detection System Β· Explainable AI
98.2%
Fraud Detection Rate Β· XGBoost Β· SHAP Β· SMOTE
Robust ML pipeline detecting fraud in highly imbalanced transaction data with SHAP-powered explainability for regulatory transparency.
Heart Disease Analysis Β· Healthcare Analytics
92.1%
Recall Rate Β· SQL Β· Tableau Β· Clinical KPIs
Clinical risk factor analysis with interactive Tableau dashboards surfacing key patterns that support preventive healthcare decisions.
πŸ“Š Analytics
πŸ€– Machine Learning
πŸ“ˆ Insights
Mohan S β€” Data Analyst
6+
Projects
9+
Tools
10+
Certifications
ML
Capable

Data Analyst

Turning data into actionable business insights through analytics, machine learning, and visualization.

I bridge the gap between raw data and business decisions by transforming complex datasets into actionable insights. My approach combines analytical thinking with business context β€” focusing not just on what the data shows, but what decisions it can support.

I have hands-on experience across the end-to-end analytics workflow, including data cleaning, exploratory analysis, predictive modeling, visualization, and dashboard development. Every project I build is centered around a key business question and measurable outcomes.

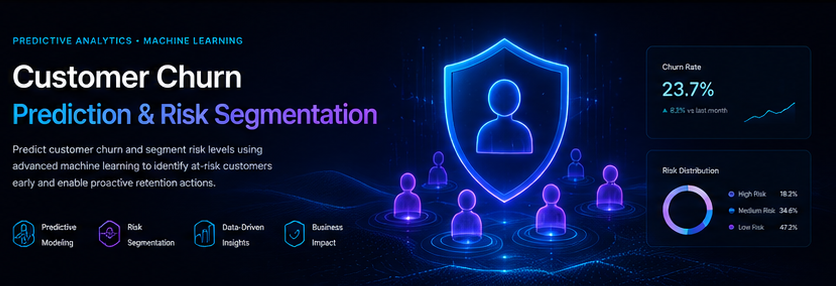
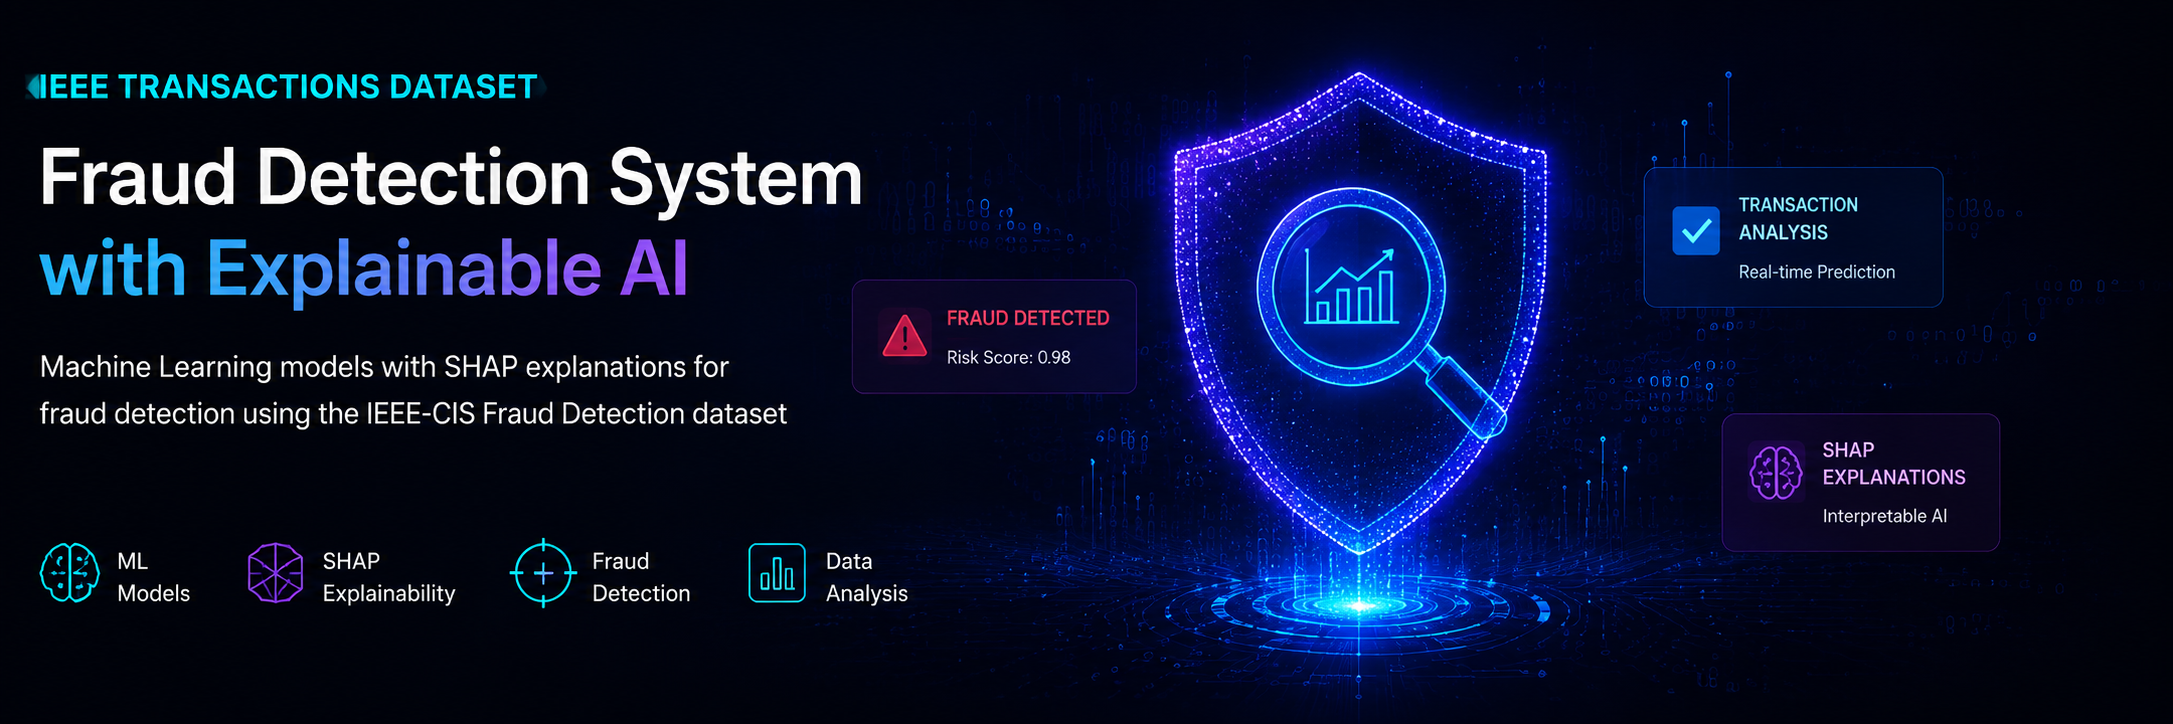
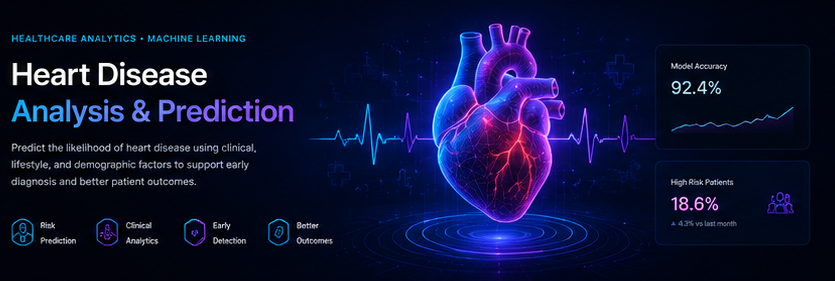
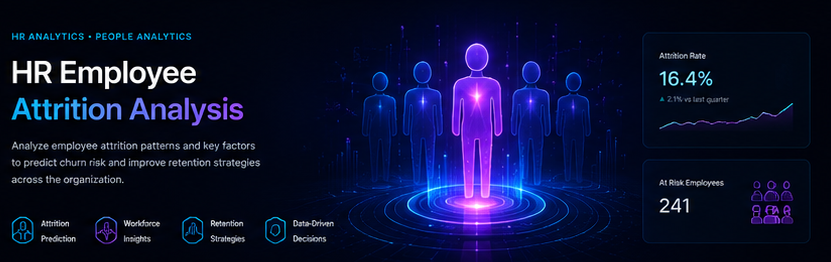
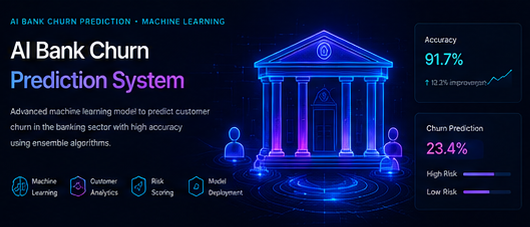
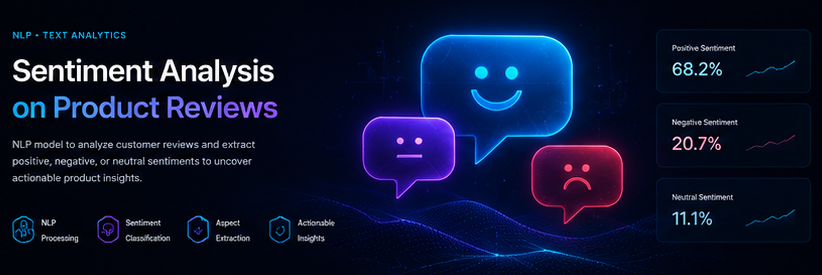
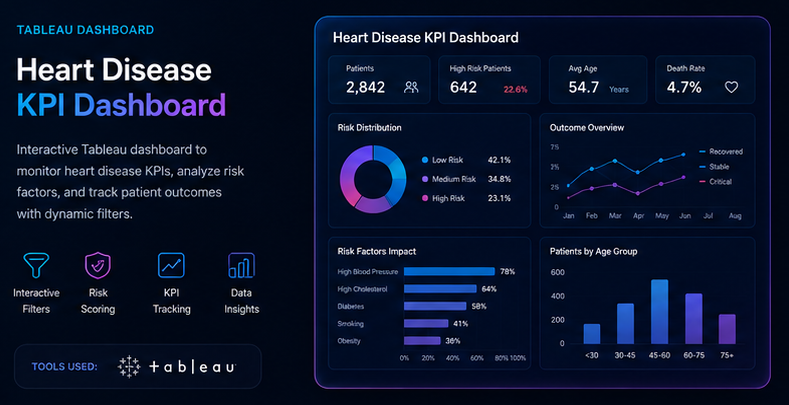
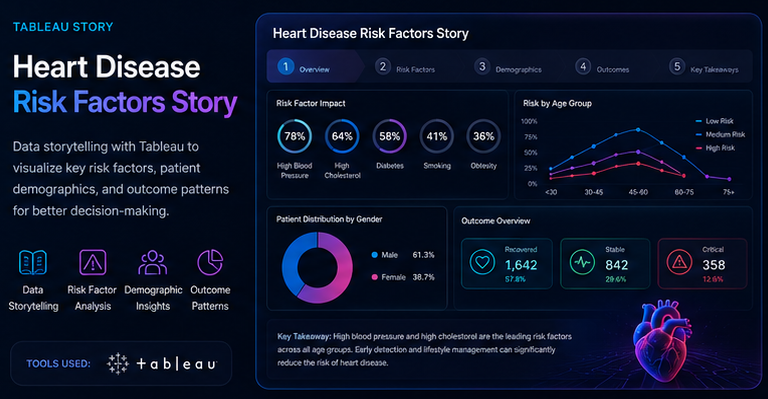
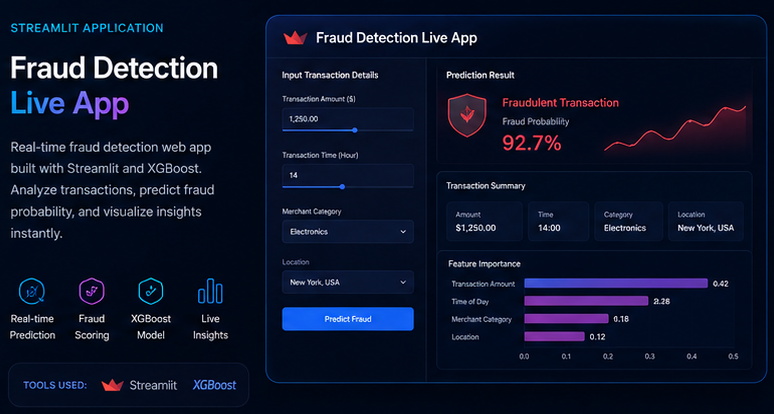
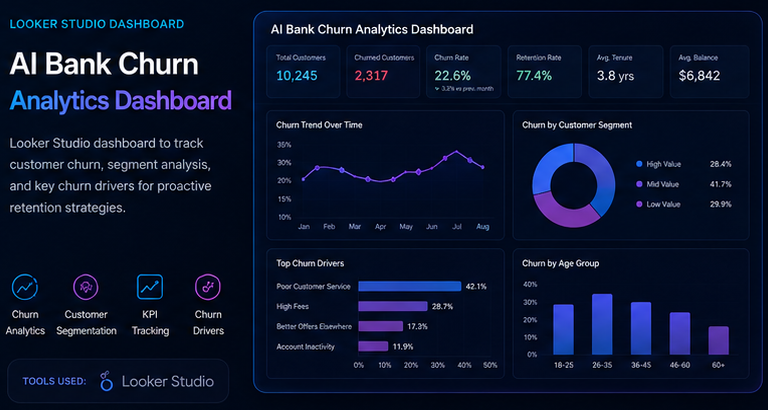
My technical toolkit includes SQL, Python, machine learning, and modern BI platforms. Through academic and personal projects, I have worked on healthcare analytics, HR workforce insights, fraud detection, customer churn prediction, and NLP-based sentiment analysis.

  • End-to-end analytics workflows from raw data to interactive dashboards
  • Predictive modeling using XGBoost, LightGBM, scikit-learn, and SHAP explainability
  • Data storytelling with Tableau, Power BI, and Looker Studio
  • Business-focused insight generation and decision support
  • Projects across healthcare, finance, HR, and e-commerce domains

Experience

Internships and virtual experience programs that shaped my analytics and development skills.

XYlofy AI
AI & Data Analyst Intern
Apr 2026 – May 2026
Remote Β· 4-Week Internship
  • Gained practical experience in Artificial Intelligence, Machine Learning, Data Analysis, and Data Visualization in a startup AI environment.
  • Applied data-driven decision-making techniques to real-world AI use cases; demonstrated analytical thinking and commitment to delivering actionable insights.
  • Completed end-to-end weekly projects including Sentiment Analysis, Customer Churn Prediction, and Fraud Detection System with Explainable AI.
SmartBridge Educational Services Pvt. Ltd
Data Analytics Intern
Oct 2025 – Mar 2026
Virtual Β· 240-hour Long-Term Internship Β· APSCHE–JNTUA Collaboration
  • Completed a 240-hour structured internship on Data Analytics with Tableau, covering end-to-end data analysis workflows, dashboard creation, and stakeholder reporting.
  • Applied EDA, KPI development, and data visualization techniques to real-world datasets across multiple business domains using Python and SQL.
CODTECH IT Solutions
Python Programming Intern
Aug – Oct 2025
Remote
  • Developed Python scripts for data processing and automation; built reusable utility modules for file I/O and data transformation pipelines, reducing repetitive code by ~40%.
  • Strengthened proficiency in data wrangling, scripting, and code structuring following software engineering best practices.
CODTECH IT Solutions
Full Stack Web Development Intern
Dec 2024 – Jan 2025
Remote
  • Built and deployed web application features with responsive UI components and RESTful API integration; improved cross-device load consistency by 30%.

Technical Skills

A structured, end-to-end approach to solving business problems with data β€” from ingestion to insight delivery.

Languages
PythonSQL (MySQL)
Data Analysis & Cleaning
PandasNumPyMatplotlibSeabornPlotlyMicrosoft ExcelData WranglingData Cleaning
ML Libraries
Scikit-learnXGBoostLightGBMSHAPSMOTE
Visualization & BI
TableauPower BIGoogle Looker StudioStreamlit
Database
MySQLMySQL Workbench
Tools & Platforms
GitGitHubFlaskJupyter NotebookGoogle Colab
Analytics
EDAKPI DevelopmentData ModelingETLStatistical AnalysisNLPStakeholder Reporting

Featured Projects

End-to-end analytics case studies focused on solving real business problems and delivering measurable insights.

Heart Disease Analysis
Healthcare Analytics Β· Visualization
Heart Disease Analysis

Business Problem: Identifying the key clinical risk factors driving heart disease to support preventive healthcare decisions through interactive KPI dashboards.

Risk FactorsKPI DashboardsRecall 92.1%
SQLMySQLTableauFlask
HR Employee Attrition
SQL Analytics Β· HR Intelligence
HR Employee Attrition Analysis

Business Problem: High employee turnover is costly. This SQL-driven analysis surfaces attrition patterns, departmental trends, and KPIs to help HR teams intervene proactively.

Turnover RateDept. AnalysisWorkforce KPIs
SQLMySQLData Modeling
AI Bank Churn Analytics
Business Intelligence Β· Banking
AI Bank Churn Analytics

Business Problem: Banking institutions face silent churn β€” customers who disengage before leaving. This analysis identifies behavioral signals indicating early churn risk.

Behavioral PatternsChurn SignalsRetention Ops
PythonPandasNumPyMatplotlib
Sentiment Analysis
NLP Analytics Β· Consumer Insights
Sentiment Analysis on Product Reviews

Business Problem: Understanding customer sentiment at scale. This NLP pipeline classifies thousands of product reviews to surface brand perception trends and improvement areas.

Sentiment ScoreBrand PerceptionTrend Analysis
PythonNLPPandasData Cleaning

Dashboards & BI Work

Interactive dashboards built in Tableau, Looker Studio, and Streamlit to communicate insights visually.

Heart Disease KPI Dashboard
Tableau Β· Interactive Filters Β· Risk Scoring
Open in Tableau β†’
Heart Disease Risk Factors Story
Tableau Story Β· Visual Narrative Β· Data Storytelling
Open Story β†’
Fraud Detection Live App
Streamlit Β· XGBoost Β· SHAP Β· Real-time Prediction
Open Live App β†’
AI Bank Churn Analytics Dashboard
Google Looker Studio Β· KPI Tracking Β· Churn Insights
Open in Looker Studio β†’

Certifications

Industry-recognized certifications and job simulations across analytics, BI, and data science domains.

πŸ“Š Data Analytics
  • Career Essentials in Data Analysis β€” Microsoft & LinkedIn
  • Intro to Career Skills in Data Analytics
  • Business Analytics with Excel
πŸ—„οΈ SQL & Python
  • SQL and Relational Databases 101 β€” IBM
  • Python 101 for Data Science β€” IBM
πŸ“ˆ Visualization Tools
  • Power BI for Beginners β€” Simplilearn
  • Tata Data Visualization Job Simulation
πŸ’Ό Job Simulations
  • JP Morgan β€” Quantitative Research Virtual Experience
  • Deloitte β€” Data Analytics Virtual Experience
  • Quantium β€” Data Analytics Virtual Experience
  • Tata β€” GenAI Powered Data Analytics
🏒 Business Analytics
  • Business Analytics with Excel β€” Simplilearn
🀝 Industry Partners
  • JP Morgan Chase & Co.
  • Tata Consultancy Services
  • Deloitte
  • Quantium
πŸŽ“ Education
B.Tech – Computer Science Engineering (CSE)
Siddharth Institute of Engineering & Technology, Puttur
Specialization: IoT, Cybersecurity & Blockchain
Sept 2022 – May 2026

GitHub Activity

MS
Mohan S
@smohan-21 Β· github.com/smohan-21
View GitHub β†’
6+
Repositories
Python
Top Language
ML Β· SQL
Focus Areas
Active
Status
Contribution Activity
customer-churn-prediction
ML-based churn prediction with risk segmentation and retention insights
Python Β· ML Β· Scikit-learn
fraud-detection-explainable-ai
Fraud detection on imbalanced data with XGBoost, SHAP & Flask deployment
Python Β· XGBoost Β· SHAP
heart-disease-analysis
Healthcare analytics with Tableau dashboards and KPI visualizations
SQL Β· Tableau Β· MySQL

Download Resume

πŸ“„
Mohan S β€” Data Analyst Resume

A business-focused resume highlighting analytics projects, ML capabilities, and BI tool expertise β€” optimized for recruiter ATS systems.

Key Highlights
  • βœ“  Fraud Detection β€” 98.2% accuracy with XGBoost, LightGBM, SHAP & Flask
  • βœ“  Customer Churn Prediction β€” 87.4% accuracy with Scikit-learn ML pipeline
  • βœ“  Heart Disease Analysis β€” 92.1% recall, Tableau KPI dashboards
  • βœ“  240-hour Data Analytics Internship β€” SmartBridge (APSCHE–JNTUA)
  • βœ“  5 Industry Simulations β€” JPMorgan, Tata, Deloitte, Quantium
  • βœ“  10+ Certifications β€” IBM, Microsoft, Simplilearn
  • βœ“  Tools: SQL Β· Python Β· XGBoost Β· LightGBM Β· SHAP Β· Tableau Β· Power BI Β· Looker Studio
Download Resume PDF β†’

Let's Connect

Open to data analyst, business analyst, and BI analyst opportunities. Whether you want to discuss a project, collaboration, or have an open role β€” I'd love to connect.

βœ… Message sent! I'll get back to you soon.